Saturday, May 17, 2014

Review: 4.5-Graphs of sine and cosine functions

Properties of sine and cosine functions
1. The domain is the set of real numbers.
2. The range is the set of y values such that −1≤ y ≤1
3. The maximum value is 1 and the minimum value is –1.
5. Each function cycles through all the values of the range 2π over an x-interval of 2π
6. The cycle repeats itself indefinitely in both directions of the x-axis.

The standard equations for sine and cosine are:

y = a sin b (x - c)
y = a cos b (x – c)

  • |a| is the amplitude of the sine or cosine graph. 
  • The amplitude describes the height of the graph.
  • “b” affects the period of the sine or cosine graph. 
  • “c” indicates the phase shift of the sine graph or of the cosine graph. 
  • The x-coordinate of the key point is c.
The standard graphs of sine and cosine are: 


Math joke of the day: 

Review: 9.4-Mathematical Induction

Mathematical induction is a way of proving an equation.

These are the steps of mathematical induction:
1)Prove the statement is true at the starting point (n = 1).
2) Assume the statement is true for n.
3) Prove the statement is true for n + 1.
4) If the LHS and RHS equate, the statement is true for “all n element of natural numbers,” which can be denoted as ∨ n € |N.

The Principle of Mathematical Induction

• Let P(n) be a statement involving the positive integer n.

o If P(1) is true, and

o 2) the truth of P(k) implies the truth of P(k + 1), for every positive k, then P(n) must be true for all positive integers n.

• To apply the Principle of Mathematical Induction, you need to be able to determine the statement P (k + 1) for a given statement P(k). It is important to recognize that both parts of the Principle are necessary components to validate your conclusion.

Example: 

• Prove: 1 + 3 + 5 + 7… + (2n – 1) = n^2
• Step 1: Prove the statement is true for n = 1.

o LHS: (2n – 1) = (2(1) – 1) = 1.

o RHS: n^2 = 1^2 = 1.

o Because the LHS = RHS, the statement is true for n = 1.

• Step 2: Assume the statement is true for n.

o 1 + 3 + 5 + 7… (2n – 1) = n^2 ‡ true.

• Step 3: Prove the statement is true for n + 1.

o 1 + 3 + 5 + 7… 2 (n + 1) – 1 = (n + 1)^ 2.

o Here, you are replacing each n for n + 1 in the equation.

o 1 + 3 + 5 + 7… 2n + 1 = (n + 1)^2.

o LHS: n^2 + 2n + 1 = (n + 1)^2.

o Here, 1 + 3 + 5 + 7 can be replaced by n^2 because in Step 2 you stated that the

o (n + 1) (n + 1) = (n + 1)^2

o (n + 1)^2 = (n + 1)^2.

• Step 4: State your conclusion.

o Because the LHS = RHS, the statement is true for n + 1. Therefore, the statement equation is equal to n^2. is true for ∨ n € |N “all n element of natural numbers” by mathematical induction.

Math joke of the day:


Review: 9.5-Binomial Theorem

Binomial: a polynomial that has two terms; (x+y)n

Expansion Formulas: 
(x+y)0=1
(x+y)1=x+y
(x+y)2=x2+2xy+y2
(x+y)3=x3+3x2y+3xy2+y3
(x+y)4=x4+4x3y+6x2y

Alternate Method: Pascal's Triangle

  • Alternately, you can use Pascal's triangle to expand any given polynomial
  • Using pascal’s triangle using the number of the exponent you can use the row that corresponds to that number to find the answer and put declining powers on the first term and increasing powers on the second term. 
  • This is easier to explain using an example: 


Math Joke of the Day: 

A mathematical children's book

Thursday, May 8, 2014

Review: 5.2-Verifying Trigonometric Identities

Sabrina W. did her presentations on verifying trig equations by using trig identities. This is a hard lesson and it really helps to practice, practice, practice. There are only so many tips that Miss V and Sabrina can give us, the rest is critical thinking.

Rules for verifying trigonometric identities:
1. Work with only one side the equation
2. Factor an expression, add fractions, square binomials, or create a monomial denominator
3. Look for opportunities to use the fundamental identities
4. Convert all terms to sines and cosines if the preceding guidelines do not help

To verify trig equations, you really need to know your trig identities, especially your Reciprocal identities, Pythagorean identities, Quotient identities, Co-Function identities, and Parity identities. Because of the trig quizzes, you should have all these identities memorized, but if you don't or you just need some review, all the trig identities can be found in the back of or textbook and were also posted on edmodo.

Math joke of the day:

Review: 8.1-Matrices and Systems of Equations

Teddy did his presentation on matrices and systems of equations. Here is a quick run-down on this section.

We can find the solutions of matrices by getting them into row-echelon form using the elementary row operations and/or back substitution.

Elementary row options
1. Interchange two equations
2  Multiply an equation by a nonzero equation
3. Add a multiple of an equation to another equation.


Row-echelon form: the necessary form we need for augmented matrices and system of equations.
1. Rows consisting of zeroes belong at the bottom
2. First nonzero has a 1
3. For each row the leading 1 in the higher row is to the left of the lower one.

Here are some examples of matrices in row-echelon form:


How to solve system of equations through Gaussian elimination with back substitution.

1. Get the matrix in row-echelon form using elementary row operations
2. Use back substitution to solve for each variable.

Gauss-Jordan elimination

1. Obtain the reduced row-echelon form using elementary row operations.
2. Variables are equal to the coefficients on the right.

Math joke of the day:

Review: 6.4-Vectors and Dot Products

One of the first review presentations was Darron's on vectors and dot products. Here is an overview this topic. 

Dot Product of Two Vectors
-The dot product of u = <a,b> and v = <c,d> is u • v =  ac + bd 

-The properties of the dot products of two vectors are as follows: Let u, v, and w be vectors in a plane or in space and let c be a scalar.

1. u • v = v • u 2. 0 • v = 0 3. u • (v + w) = u • v + u • w 4. v • v = ll v ll ²  5. c(u • v) = cu • v = u • c


The Angle Between Two Vectors 


If ø is the angle between two nonzero vectors u and v, then cos ø = u • v / ll u ll ll v ll


Vectors u and v  are orthogonal if u • v = 0 


Vector Components
Let u and v be nonzero vectors such that u = w + twhere w and t are orthogonal and w is parallel to v. The vectors w and t are called vector components of u


The vector w is the projection of u onto v and is denoted byw = proj v uThe vector t is given by t = u - w
Let u and v be nonzero vectors. The projection of u onto v isproj v u = (u • v/ ll v ll²)v
Work


W = ll proj PQ F ll ll PQ ll                      Projection Form W = (cos ø) ll F ll ll PQ ll = FPQ              Dot Product Form


Math Joke of the day:
Q: Why didn't the quarter roll down the hill with the nickel?
A: Because it had more cents.

Thursday, May 1, 2014

Interesting Math Stuff #14: Knot Theory

A mathematical knot is a knot that cannot be undone because the ends are joined together. In math lingo, a mathematical knot is a "embedding of a circle in 3-D Euclidean space." Two knots are equivalent if they can be transformed from one form to another via a deformation of R^3 upon itself. This basically means that if the knot could be transformed to the second know without cutting the string of passing through the string itself, then the knots are equivalent. 

Here is an picture of one of the simplest types of mathematical knots, called a trefoil knot. 


This a more complex mathematical knot. 


Math joke of the day:

12.3: Tangent Lines and introduction to derivatives

A tangent line is a line at point P that has the best approximating of the graph at that point. Here are some examples of graphs with points of tangency.


For this lesson it will also be important to remember slope. 
Slope is defined as change in x/change in y. 

The equation used to find the slope of line tangent to a graph at any given point is: 


To solve, you will need to substitute the given equations into the formula. 

Here are some examples of some problems: 


Another word for the slope of the line that is tangent to the graph is derivative. The derivative is denoted as f'(x) and read as f prime x. 

Here are some examples of finding the derivative: 


One shortcut to finding the derivative is the polynomial derivatives shortcut, but it will only work for equations in polynomial form. This can be summed up as "bring down the power and decrease by 1."

Here are some examples of finding the derivative by the polynomial shortcut: 


Math joke of the day:

Wednesday, April 30, 2014

12.2: Evaluating Limits

There are three main ways to evaluate limits.
1) direct substitution (plug-in) 
2) cancellation technique (factor and cancel) 
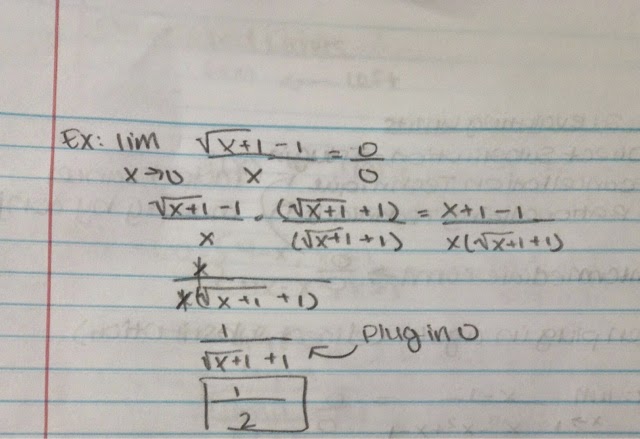
3) rationalizing technique (multiply by the conjugate-only used with problems with radicals) 

You should use the direct substitution first. If using direct substitution gives you 0/0, then it is in intermediate form. If it is in intermediate form, then you have to either use the cancellation technique or the rationalizing technique to get a new equation. Then plug the number from the original equation into the new equation. 

Example of the cancellation technique
 
Example of the rationalizing technique

One-sided limits
Sometimes there are problems like this:


In these types of problems, you have to plug it in to both eqautions. If it the result is the same for each equation then there is a limit. In this case, the limit is 3. If the result for each eqaution is different, then it is a one sided equation and you can solve for each side separately. 

In other cases, the problem has a f(x) in it and you have to first solve the function before solving the main equation to find the limit. 

Math joke of the day:


Wednesday, April 9, 2014

Interesting Math Stuff #13: John Nash

John Forbes Nash is a modern mathematician who made considerable advances in many contributions to the fields of game theory, differential geometry, no partial differential eqautions. 

One of his most interesting contributions was involved encryption which we studied earlier this year. In 2011, the NSA revealed some of Nash's letters where he discussed a new encryption/decryption machine. 

Nash was also diagnosed with paranoia and schizophrenia which caused his hospitalization. His mathematical genius and his mental disorders inspired a 2001 Hollywood film named A Beautiful Mind. 

Math joke of the day:

11.2: 3-D Vectors


Component form: v=<v1, v2, v3>
Unit vector form: v=v1i+v2j+v3k

Length formula: 


Length can also be called tension or magnitude. 

Unit Vector:


Vector addition and dot product:


Angle between two vectors formula:


Orthogonal if...

-The dot product between the two vectors is 0
-The angle between the vectors is 90 degrees

Parallel if...

u=cv
Vector 1=(constant)(vector 2) 
-the points are collinear 

Math joke of the day:


11.1: 3-D graphs introductions

Today we learned about 3-D graphs. 

With the points (x1, y1, z1) and (x2, y2, z2) 

The distance and midpoint formula:

The eqaution of a sphere:

r=radius
center=(h, k, j) 

Math joke of the day:


Monday, April 7, 2014

3-D Graphs

Check out these cool 3-D graphs I made on the apps quick graph and good graph! 


Thursday, March 27, 2014

Interesting Math Stuff #12: Pythagoras

Pythagoras was a Greek mathematician, philosopher, and the founder of the religion Pythagoreanism. He is of course, best known for the pythagorean theorem: a2=b2=c2. 


The only writings about him were written many years after his death, so we are not sure of the validity of the facts about his life. It is known in Samos, Greece. It is said that a prophet told his pregnant mother that her child would be supremely wise, beautiful, and beneficial to mankind although this is debated. Pythagoras was not only a brilliant mathematician, but also made discoveries in the fields of mathematics, astronomy, and music. He was also said to have practiced divination and prophecy, often being associated with Apollo. According to some writings, he married a woman named Theano who bore him children including a son Telauges and three daughters Damo, Arignote, and Myia.
Source: http://en.wikipedia.org/wiki/Pythagoras


Math joke of the day: 
I strongly dislike the subject of math, however  I am partial to fractions. 

10.7: Graphs of Polar Equations

Today we learned how to make graphs of polar equations.

Symmetry tests for polar coordinates 

1. Replace θ with -θ. If an equivalent equation results, the graph is symmetric with respect
to the polar axis.
2. Replace θ with -θ and r with -r. If an equivalent equation results, the graph is symmetric
with respect to θ = π .
3. Replace r with -r. If an equivalent equation results, the graph is symmetric with respect
to the pole.

Note: It is possible for a polar equation to fail a test and still exhibit that type of symmetry.

There are four main types of graphs of polar equations:

Circles
1. r = a cos θ is a circle where “a” is the diameter of the circle that has its left-most edge at
the pole.

 2. r = a sin θ is a circle where “a” is the diameter of the circle that has its bottom-most edge
at the pole.

Limaçons (Snails) 
 1. r = a ± b sin θ, where a > 0 and b > 0
2. r = a ± b cos θ, where a > 0 and b > 0

-The limaçons containing sine will be above the horizontal axis if the sign between a and b is plus or below the horizontal axis if the sign if minus.
-If the limaçon contains the function cosine then the graph will be either to the right of the vertical axis if the sign is plus or to the  left if the sign is minus.
-The ratio of a to b will determine the exact shape of the limaçon.


Rose Curves 
A rose curve is a graph that is produced from a polar equation in the form of:

 r = a sin nθ or r = a cos nθ, where a ≠ 0 and n is an integer > 1

The number of petals that are present will depend on the value of n. The value of a will determine the length of the petals.


Lemniscates 
Lemniscates have the general polar equation of:
 r2 = a2 sin 2θ or r2 = a2cos 2θ, where a ≠ 0

A lemniscate containing the sine function will be symmetric to the pole while the lemniscate containing the cosine function will be symmetric to the polar axis, to θ = 2π , and the pole.


Math joke of the day:
A team of engineers were required to measure the height of a flag pole. They only had a measuring tape, and were getting quite frustrated trying to keep the tape along the pole. It kept falling down, etc. A mathematician comes along, finds out their problem, and proceeds to remove the pole from the ground and measure it easily. When he leaves, one engineer says to the other: "Just like a mathematician! We need to know the height, and he gives us the length!"

10.6: Polar Coordinates Introduction

Today we learned about a new way to graph. Instead of having (x, y), we now have (r, Ɵ). 

The graph of polar coordinates will look something like this: 


The r counts out from the center and the Ɵ on the corresponding labeled lines. Polar coordinates can also be negative. If a r or Ɵ is negative, then then move opposite. For instance, if the point is (1, pi/12), then the point would be on the first circle from the center and in quadrant 2 (top right), but if the point is (-1, -pi/12) then the point would be on the first circle in the center in quadrant 4 (bottom left) and on the line labeled 13pi/12. 

Sometimes you will have to convert between polar equations and rectangular equations. To do this, use these equations. 

When converting from polar to rectangular, use these equations: 
x=rcosƟ
y=rsinƟ

When converting from rectangular to polar, use these equations. 
tanƟ=y/x
r^2=x^2=y^2

If you need more help, check out Miss V's lecture: 
https://docs.google.com/file/d/0B0qanadSJ9JgWlpnSEdVRGZya3c/edit

Math joke of the day:
A quote from Charles Darwin: "A mathematician is a blind man in a dark room looking for a black cat which isn't there." 


Thursday, March 20, 2014

Interesting Math Stuff #11: Taming Infinity

Please Watch this Video: Taming Infinity Video

This video covers one of the topics we went over a couple weeks ago: convergent geometric infinite sequences. The way Miss V explained it was like this: If I take one half, than I add half of one half (one fourth), then I add half of one fourth (one eighth)....for all eternity, the answer will be a natural number.

This raises some confusion and also some awe. When I think of a situation like this, I think that however many you add, the number will keep approaching the natural number, but will never reach it. So if the presumed natural number that is the sum is N, than shouldn't the sum of any given amount of numbers by <N? I suppose that to fully understand this concept, I would have to completely understand the nature of infinity. Is infinity a number or a concept? Because adding any number of terms to this a convergent geometric infinite sequence would logically result it <N, then  I guess infinity must be a concept.

Maybe by the time I finish AP Calculus, I will finally be able to wrap by head around the idea of infinity.

Math joke of the day:
Q: Did you hear about the statistician who invented a device to measure the weight of trees?
A: It is referred to as the log scale.

10.3: Hyperbolas

Here is a graphic representation of all the parts of a hyperbola:


The equations of hyperbolas are as follows. Don't forget that when talking about hyperbolas, the a does not have to be bigger than b. a will always be in front of the subtraction sign.


Center
The center will be (h,k)

Vertices
The vertices will be a units from the center point.
When the hyperbola is vertical...subtract/add a to the y value.
When the hyperbola is horizontal...subtract/add a to the x value.

Foci
The foci will be c units from the center point.
When the hyperbola is vertical...subtract/add c to the y value.
When the hyperbola is horizontal...subtract/add c to the x value.

Asymptotes
Use this formula to find the asymptotes:


 Graph the Equation. 
1. graph the vertices
2. count b from the center and draw points.
When the hyperbola is vertical...subtract/add b to the x value
When the hyperbola is horizontal...subtract/add b to the y value.
3. Draw a rectangle connecting these points.
4. Draw diagonal lines through the corners of the rectangle. These are your asymptotes.
5. Draw a hyperbola through the vertex, but not touching any of the asymptotes.

Math joke of the day:
Q: What's 2n plus 2n?
A: I don't know, it's 4n to me!


10.5: Eliminating the Parameter

To get a set of equations with three variables (usually x, y, and t) into a form where we can graph it, we have to follow these steps:
1. solve for t in one equation
2. Substitute into 2nd equation
3. Simplify and get rectangular equation (in form that we can graph in)
4. Graph using rules of conic sections (identify center, identify vertices, etc.)

Note that the two parametric equations will be given to you, usually in the form x=__ and y=__

Example problem:


Math joke of the day:
Q: How do we know that the following fractions are in Europe? A/C, X/C and W/C ?  
A: Because their numerators are all over C's

Thursday, March 13, 2014

Interesting Math Stuff #9: Priyanshi Somani

Priyanshi Somani is a fifteen year old girl who can perform amazing mental calculations. She was the youngest competitor in the Mental Calculation World Cup in 2010 at twelve years old and won the overall title. She is the only participant in the history of the competition who has achieved 100% accuracy in addition, multiplication, and square roots. 
In this competition, Priyanshi Somani was required to extract square roots from six digit numbers up to eight digits and managed to do it in 6 minutes and 51 seconds. She also added 10 numbers with 10 digits and multiplied 2 numbers of 8 digits with 100% accuracy. 
She also has a World Cup record in calculating square roots as she solved 10 square roots correctly in 6 minutes and 28 seconds on June 7, 2010. 
Priyanshi Somani is featured in the Limca Book of World Records and the Guinness Book of World Records. She has also been named the Indian Ambassador for the World Maths Day in 2011. 


Source: http://en.wikipedia.org/wiki/Priyanshi_Somani